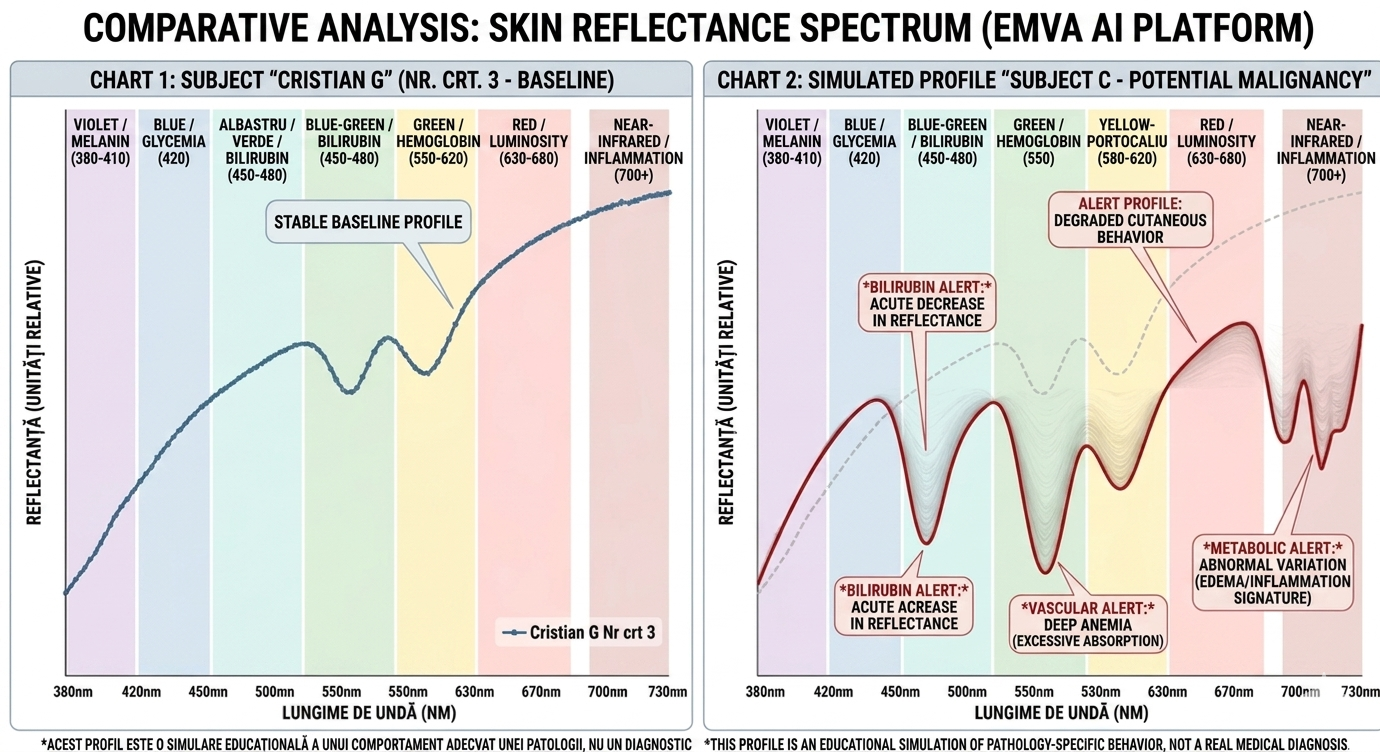
To understand the power of the EMVA platform, we must look beyond raw numbers. The Artificial Intelligence analyzes the geometry and harmony of reflectance curves, identifying patterns that the human eye or a classic algorithm could never perceive.
“Biological Beauty” vs. “Spectral Chaos” The graph above highlights a striking contrast between two completely different systemic states:
- The Green Curve (Healthy Individual / Homeostasis): Represents a smooth and predictable transition between wavelengths. Every hemoglobin molecule, hydration level, and cellular density works in perfect harmony. This uniformity is the visual translation of a balanced organism in optimal rest.
- The Red Curve (Pathological Simulation / Systemic Anomaly Profile): Represents a violent disruption of this harmony. Disease introduces disorder into the tissue. Even in an early stage, the presence of subclinical anomalies blocks or distorts the natural reflection of light, creating distinct drops in reflectance.
The Power of AI: Detecting Subtle Deviations (5% – 10%) In medicine, early screening saves lives. The graph demonstrates how the EMVA platform acts as a sentinel in the pre-clinical phase:
- Beyond Human Limits: Changes in the “Angiogenesis Zone” (530–580 nm) or alterations in the melanin plateau may represent variations of only 5% to 10% in reflectance. For a human observer or a classic in-office test, this difference is completely invisible, and the patient remains asymptomatic (experiences no pain).
- The Early Warning Phase: The AI algorithm instantly isolates this “tremor” or “valley” in the graph. It recognizes that the alteration is not caused by fatigue or skin phototype, but rather represents an abnormal biochemical signature. The system triggers a digital alert before the underlying condition becomes visible to the naked eye or produces physical symptoms.
“Health has a harmonious visual signature, whereas disease introduces optical chaos. The EMVA platform does not wait for the graph to become a dramatic distortion; our algorithm identifies the anomaly while it is still a mere 5% false note in the body’s biological symphony.”